
Introduction
Heart disease describes a range of conditions that affect your heart. Diseases under the heart disease umbrella include blood vessel diseases, such as coronary artery disease, heart rhythm problems (arrhythmias) and heart defects you’re born with (congenital heart defects), among others.
The term “heart disease” is often used interchangeably with the term “cardiovascular disease”. Cardiovascular disease generally refers to conditions that involve narrowed or blocked blood vessels that can lead to a heart attack, chest pain (angina) or stroke. Other heart conditions, such as those that affect your heart’s muscle, valves or rhythm, also are considered forms of heart disease.
Heart disease is one of the biggest causes of morbidity and mortality among the population of the world. Prediction of cardiovascular disease is regarded as one of the most important subjects in the section of clinical data analysis. The amount of data in the healthcare industry is huge. Data mining turns the large collection of raw healthcare data into information that can help to make informed decisions and predictions.
According to a news article, heart disease proves to be the leading cause of death for both women and men. The article states the following :
About 610,000 people die of heart disease in the United States every year–that’s 1 in every 4 deaths.1
Heart disease is the leading cause of death for both men and women. More than half of the deaths due to heart disease in 2009 were in men.1
Coronary Heart Disease(CHD) is the most common type of heart disease, killing over 370,000 people annually.
Every year about 735,000 Americans have a heart attack. Of these, 525,000 are a first heart attack and 210,000 happen in people who have already had a heart attack.
This makes heart disease a major concern to be dealt with. But it is difficult to identify heart disease because of several contributory risk factors such as diabetes, high blood pressure, high cholesterol, abnormal pulse rate, and many other factors. Due to such constraints, scientists have turned towards modern approaches like Data Mining and Machine Learning for predicting the disease.
Machine learning (ML) proves to be effective in assisting in making decisions and predictions from the large quantity of data produced by the healthcare industry.
In this article, I will be applying Machine Learning approaches(and eventually comparing them) for classifying whether a person is suffering from heart disease or not, using one of the most used dataset — Cleveland Heart Disease dataset from the UCI Repository.
As always, you can find the code used in this article in the Github Repository.
The Data
The dataset used in this article is the Cleveland Heart Disease dataset taken from the UCI repository.

The dataset consists of 303 individuals data. There are 14 columns in the dataset, which are described below.
- Age: displays the age of the individual.
- Sex: displays the gender of the individual using the following format :
1 = male
0 = female - Chest-pain type: displays the type of chest-pain experienced by the individual using the following format :
1 = typical angina
2 = atypical angina
3 = non — anginal pain
4 = asymptotic - Resting Blood Pressure: displays the resting blood pressure value of an individual in mmHg (unit)
- Serum Cholestrol: displays the serum cholesterol in mg/dl (unit)
- Fasting Blood Sugar: compares the fasting blood sugar value of an individual with 120mg/dl.
If fasting blood sugar > 120mg/dl then : 1 (true)
else : 0 (false) - Resting ECG : displays resting electrocardiographic results
0 = normal
1 = having ST-T wave abnormality
2 = left ventricular hyperthrophy - Max heart rate achieved : displays the max heart rate achieved by an individual.
- Exercise induced angina :
1 = yes
0 = no - ST depression induced by exercise relative to rest: displays the value which is an integer or float.
- Peak exercise ST segment :
1 = upsloping
2 = flat
3 = downsloping - Number of major vessels (0–3) colored by flourosopy : displays the value as integer or float.
- Thal : displays the thalassemia :
3 = normal
6 = fixed defect
7 = reversible defect - Diagnosis of heart disease : Displays whether the individual is suffering from heart disease or not :
0 = absence
1, 2, 3, 4 = present.
Why these parameters:
In the actual dataset, we had 76 features but for our study, we chose only the above 14 because :
- Age: Age is the most important risk factor in developing cardiovascular or heart diseases, with approximately a tripling of risk with each decade of life. Coronary fatty streaks can begin to form in adolescence. It is estimated that 82 percent of people who die of coronary heart disease are 65 and older. Simultaneously, the risk of stroke doubles every decade after age 55.
- Sex: Men are at greater risk of heart disease than pre-menopausal women. Once past menopause, it has been argued that a woman’s risk is similar to a man’s although more recent data from the WHO and UN disputes this. If a female has diabetes, she is more likely to develop heart disease than a male with diabetes.
- Angina (Chest Pain): Angina is chest pain or discomfort caused when your heart muscle doesn’t get enough oxygen-rich blood. It may feel like pressure or squeezing in your chest. The discomfort also can occur in your shoulders, arms, neck, jaw, or back. Angina pain may even feel like indigestion.
- Resting Blood Pressure: Over time, high blood pressure can damage arteries that feed your heart. High blood pressure that occurs with other conditions, such as obesity, high cholesterol or diabetes, increases your risk even more.
- Serum Cholesterol: A high level of low-density lipoprotein (LDL) cholesterol (the “bad” cholesterol) is most likely to narrow arteries. A high level of triglycerides, a type of blood fat related to your diet, also ups your risk of a heart attack. However, a high level of high-density lipoprotein (HDL) cholesterol (the “good” cholesterol) lowers your risk of a heart attack.
- Fasting Blood Sugar: Not producing enough of a hormone secreted by your pancreas (insulin) or not responding to insulin properly causes your body’s blood sugar levels to rise, increasing your risk of a heart attack.
- Resting ECG: For people at low risk of cardiovascular disease, the USPSTF concludes with moderate certainty that the potential harms of screening with resting or exercise ECG equal or exceed the potential benefits. For people at intermediate to high risk, current evidence is insufficient to assess the balance of benefits and harms of screening.
- Max heart rate achieved: The increase in cardiovascular risk, associated with the acceleration of heart rate, was comparable to the increase in risk observed with high blood pressure. It has been shown that an increase in heart rate by 10 beats per minute was associated with an increase in the risk of cardiac death by at least 20%, and this increase in the risk is similar to the one observed with an increase in systolic blood pressure by 10 mm Hg.
- Exercise induced angina: The pain or discomfort associated with angina usually feels tight, gripping or squeezing, and can vary from mild to severe. Angina is usually felt in the center of your chest but may spread to either or both of your shoulders, or your back, neck, jaw or arm. It can even be felt in your hands. o Types of Angina a. Stable Angina / Angina Pectoris b. Unstable Angina c. Variant (Prinzmetal) Angina d. Microvascular Angina.
- Peak exercise ST segment: A treadmill ECG stress test is considered abnormal when there is a horizontal or down-sloping ST-segment depression ≥ 1 mm at 60–80 ms after the J point. Exercise ECGs with up-sloping ST-segment depressions are typically reported as an ‘equivocal’ test. In general, the occurrence of horizontal or down-sloping ST-segment depression at a lower workload (calculated in METs) or heart rate indicates a worse prognosis and higher likelihood of multi-vessel disease. The duration of ST-segment depression is also important, as prolonged recovery after peak stress is consistent with a positive treadmill ECG stress test. Another finding that is highly indicative of significant CAD is the occurrence of ST-segment elevation > 1 mm (often suggesting transmural ischemia); these patients are frequently referred urgently for coronary angiography.
The Approach
The code for this article can be found here.
The code is implemented in Python and different classification models are applied.
In this article I will be using the following classification models for classification :
- SVM
- Naive Bayes
- Logistic Regression
- Decision Tree
- Random Forest
- LightGBM
- XGboost
Data Analysis
Let us look at the people’s age who are suffering from the disease or not.
Here, target = 1 implies that the person is suffering from heart disease and target = 0 implies the person is not suffering.

We see that most people who are suffering are of the age of 58, followed by 57.
Majorly, people belonging to the age group 50+ are suffering from the disease.
Next, let us look at the distribution of age and gender for each target class.
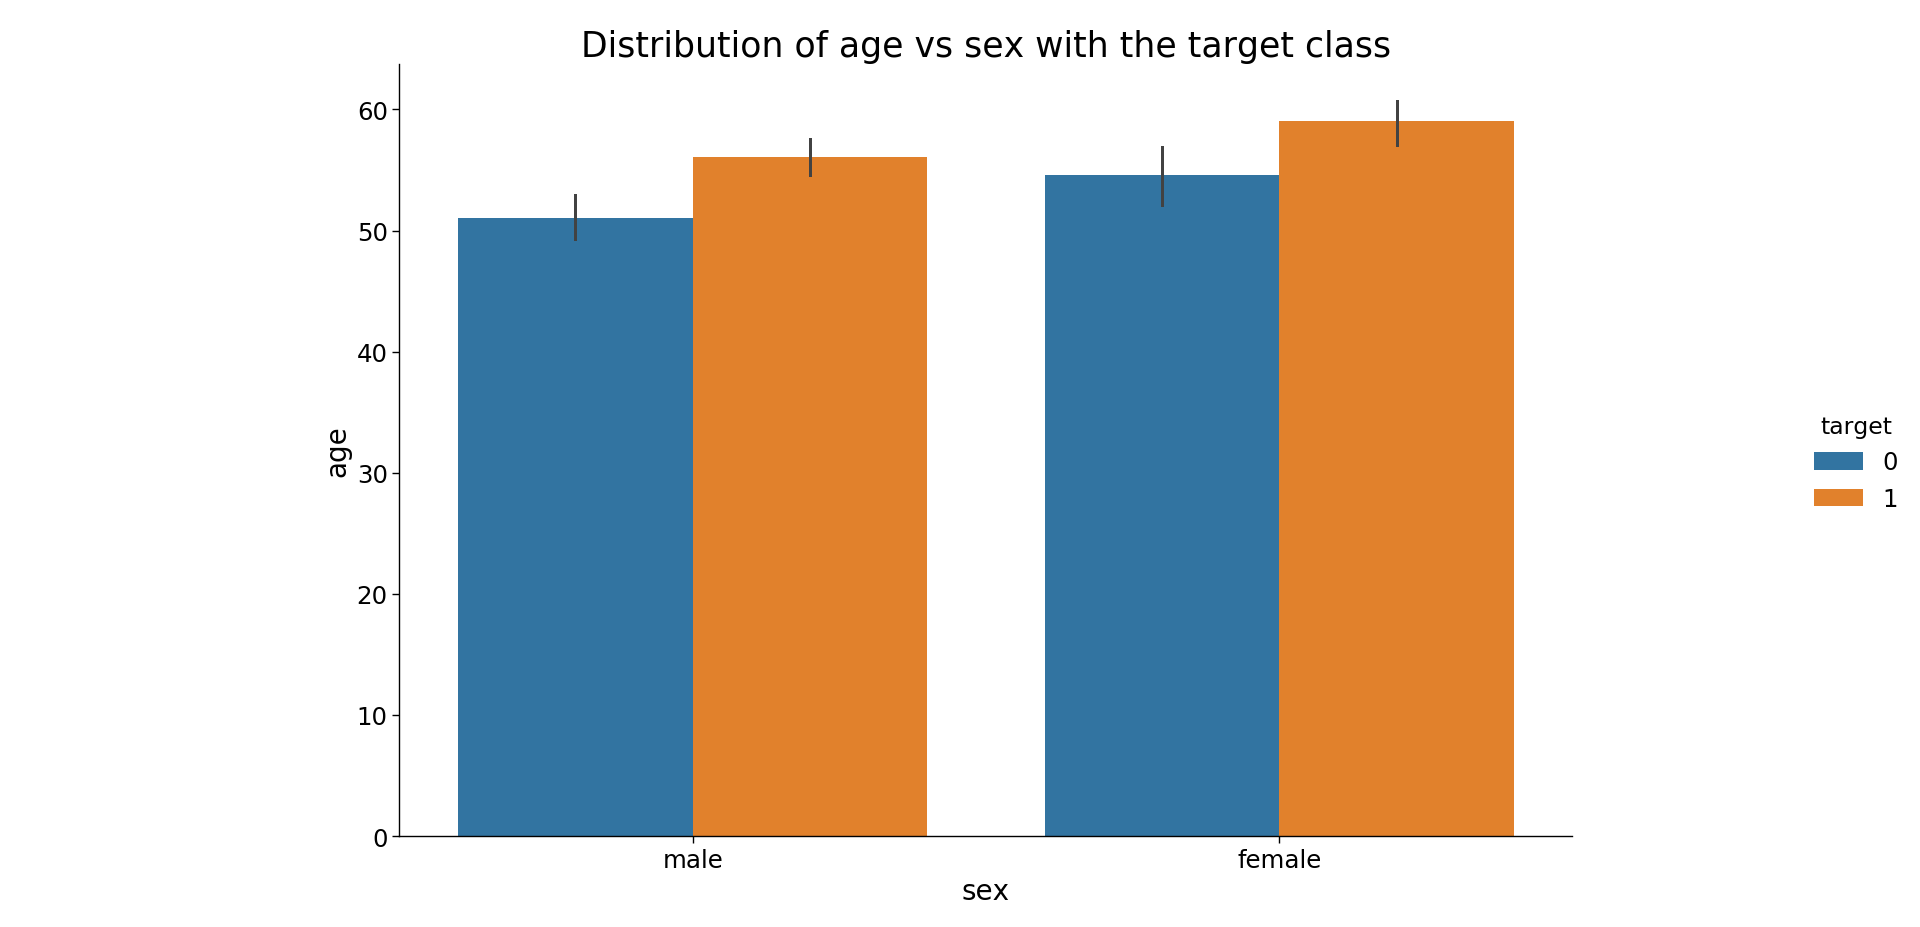
We see that for females who are suffering from the disease are older than males.
Data Pre-Processing
The dataset contains 14 columns and 303 rows.
Let us check the null values

We see that there are only 6 cells with null values with 4 belonging to attribute ca and 2 to thal.
As the null values are very less we can either drop them or impute them. I have imputed the mean in place of the null values however one can also delete these rows entirely.
Now let us divide the data in the test and train set.
In this project, I have divided the data into an 80: 20 ratio. That is, the training size is 80% and testing size is 20% of the whole data.
Training
All the models discussed above are applied to get the results.
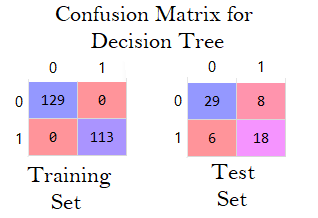
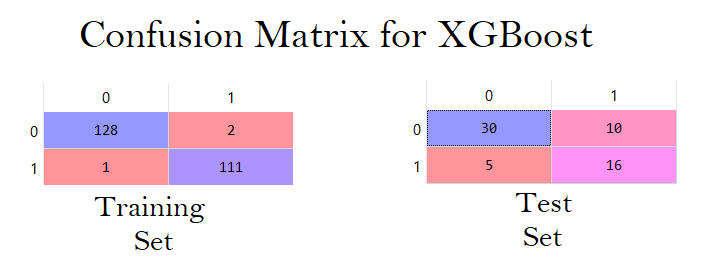
The evaluation metric used is the confusion matrix.

The confusion matrix displays the correctly predicted as well as incorrectly predicted values by a classifier.
The sum of TP and TN, from the confusion matrix, is the number of correctly classified entries by the classifier.
SVM

Accuracy for SVM for training set = ((124+100)/(5+13+124+100))*100 = 92.51%
Accuracy for SVM for test set = 80.32%
Similarly let us look at all the confusion matrices for each classifier.
Naive Bayes

Logistic Regression

Decision Tree
Random Forest

LightGBM

XGBoost
To sum up, here are all the accuracies at once for all the classifiers.
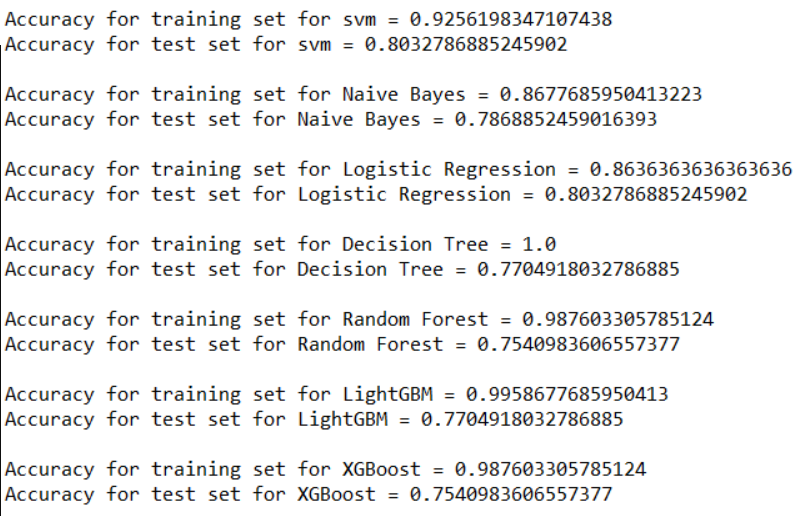
We see that the highest accuracy for the test set is achieved by Logistic Regression and SVM which is equal to 80.32%.
The highest accuracy for the training set is 100% achieved by Decision Tree.
The algorithms are implemented with the default parameters only.
Conclusion
Heart Disease is one of the major concerns for society today.
It is difficult to manually determine the odds of getting heart disease based on risk factors. However, machine learning techniques are useful to predict the output from existing data.