e-Attendance
Please follow the steps to complete your e-attendance
- Click this link
- Get your Student ID
- Class ID: 36716
- User Guide
All Resources
Section 1: Jump in and get Qlik-ing!
Kicking things off with some real-world data. In this first section, we make use of a file which has been obtained from the Kaggle website, relating to Airbnb listings in Berlin.
The original file was scraped from the Airbnb website on 7 November 2018.
Section 2: Qlik Sense Basics
In this section, we connect to a basic CSV file using the data manager.
Section 3: Building our first dashboard
Once again we will connect to an Excel file, but this time it has two tabs that need to be associated.
Section 4: Qustomizing Qlik Sense
These are some suggested image files – you can use your own as well.
This section does not have any additional data files to be downloaded. Be sure to complete Section 3 before starting this section, as we will use the completed Qlik Sense app from Section 3 as a starting point for this section.
Section 5: Sharing our work
This section does not have any additional data files to be downloaded. Be sure to complete Section 3 before starting this section, as we will use the completed Qlik Sense app from Section 3 as a starting point for this section.
Section 6: Data preparation
Mixed bag of files for this section, and here we will learn how to connect different types of data files.
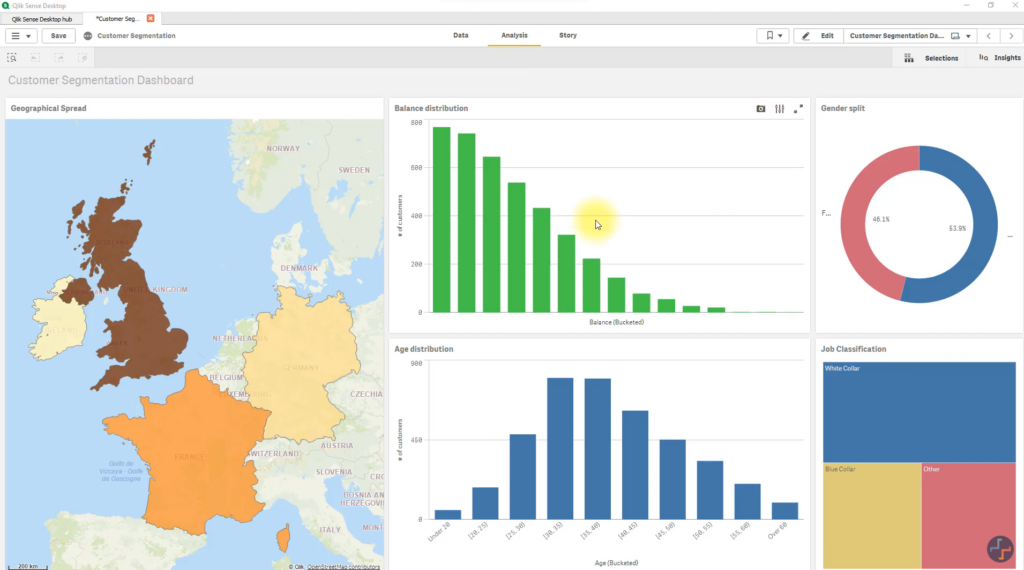
Practice-1
Dataset : BankCustomers

Practice-2
Geo analysis and Correlation
Usecase: Practics-2-Usecase
One of the CSV files for this section have been compressed to reduce its size – do ensure to unzip all files after download before continuing.
- Chicago_Crimes_2018.zip (Note: Unzip this file)
- Chicago Temps 2018.xlsx
- Chicago Daylight Hours.csv
