Intro to Python
Python – A Quick Review
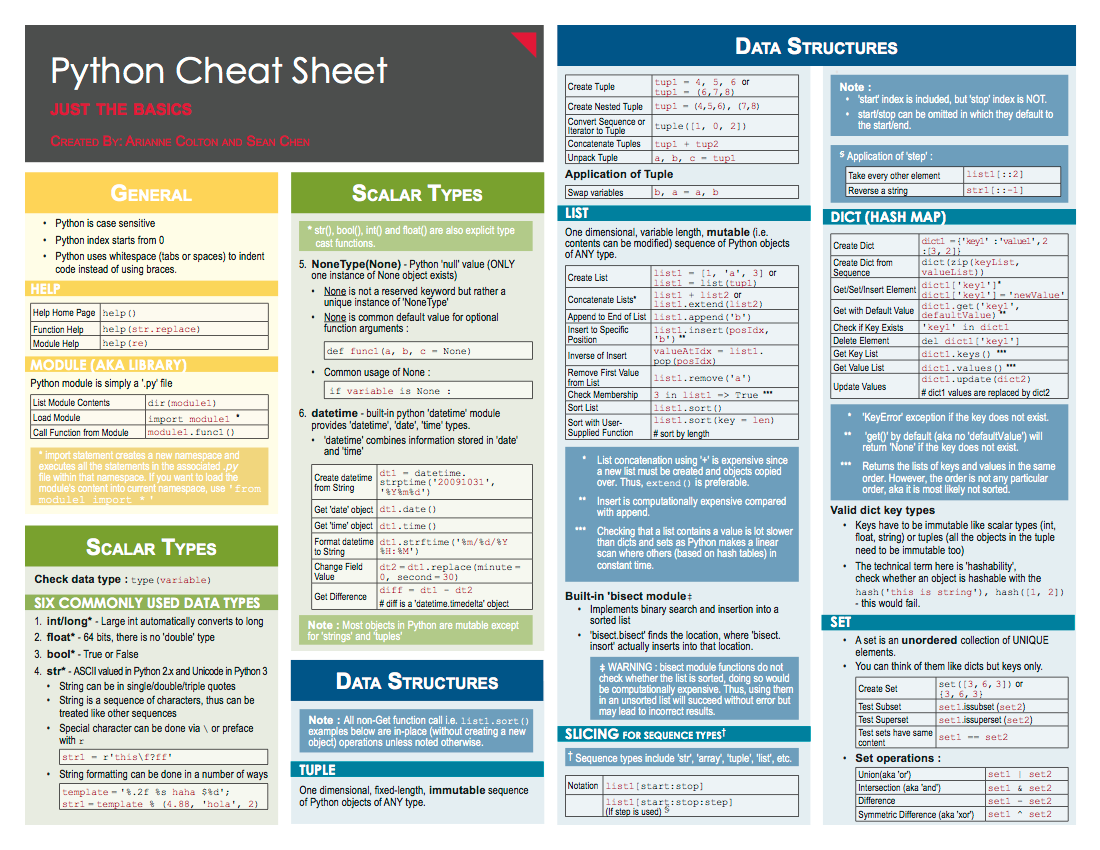
In this module, you will get a quick review on Python Language. We will not going in depth but we will try to discuss some important components of Python Language. Please note, this is not meant to be a comprehensive overview of Python or programming in general
Hands-on : Environment Setup and Jupyter Notebook Intro.
Hands-on : Python Code Along
Hands-on : Python Review Exercise
[Pandas]
Source: https://pandas.pydata.org/Pandas_Cheat_Sheet.pdf
[Matplotlib]
Source: https://matplotlib.org/cheatsheets/cheatsheets.pdf
[Seaborn]
[Scikit Learn]
Source: https://s3.amazonaws.com/assets.datacamp.com/blog_assets/Scikit_Learn_Cheat_Sheet_Python.pdf
I wanted to point out some helpful links for practice. Don’t worry about being able to do these exercises, I just want you to be aware of the links so you can visit them later.
Basic Practice:
More Mathematical (and Harder) Practice:
https://projecteuler.net/archives
List of Practice Problems:
http://www.codeabbey.com/index/task_list
A SubReddit Devoted to Daily Practice Problems:
https://www.reddit.com/r/dailyprogrammer
A very tricky website with very few hints and touch problems (Not for beginners but still interesting)
Open Jupyter Notebook
- Please follow this link to know about how to open Jupyter Notebook from your Local Machine (in your specified directory)
- For a complete User Manual check out the Bryn Mawr College Computer Science Guide.
Data Analysis & Visualization Using Python
Module 1: Python for Data Analysis ( Pandas )
Pandas is a fast, powerful, flexible and easy to use open source data analysis and manipulation tool, built on top of the Python programming language.
Hands-on : Using Python Pandas Library
Module 2: Data Visualization/EDA/Data Analysis ( Descriptive Statistics and Seaborn)
In this part of the course we will discuss methods of descriptive statistics. You will learn what cases and variables are and how you can compute measures of central tendency (mean, median and mode) and dispersion (standard deviation and variance). Next, we discuss how to assess relationships between variables, and we introduce the concepts correlation and regression.
Hands-on : Using Python Seaborn Visualization Library
Code Along for Python Pandas (Goolge Colab link)
- Click here
Dataset : Loan_Approval_Data
Exercise: 1 for Pandas
- Download .ipynb file from here [SF Salaries Exercise] ( It’s a zip file . You need to Unzip and use)
- Dataset you can download from here [Salaries] ( It’s a zip file . You need to Unzip and use)
- Solution Colab Link is here
Exercise: 2 for Pandas
- Download .ipynb file from here [Ecommerce Purchases Exercise] ( It’s a zip file . You need to Unzip and use)
- Dataset you can download from here [Ecommerce Purchases] ( It’s a zip file . You need to Unzip and use)
- Solution Colab Link is here
Code Along for Python Seaborn (Goolge Colab link)
- Click here
Exercise: 1 for Seaborn
- Download .ipynb file from here [Seaborn Exercises] ( It’s a zip file . You need to Unzip and use)
- Solution Colab Link is here
Exercise: 2 for Pandas with Seaborn
- Download .ipynb file from here [01-911 Calls Data Capstone Project] ( It’s a zip file . You need to Unzip and use)
- Dataset you can download from here [911] ( It’s a zip file . You need to Unzip and use)
- Solution Colab Link is here
Data Visualization Using Power BI
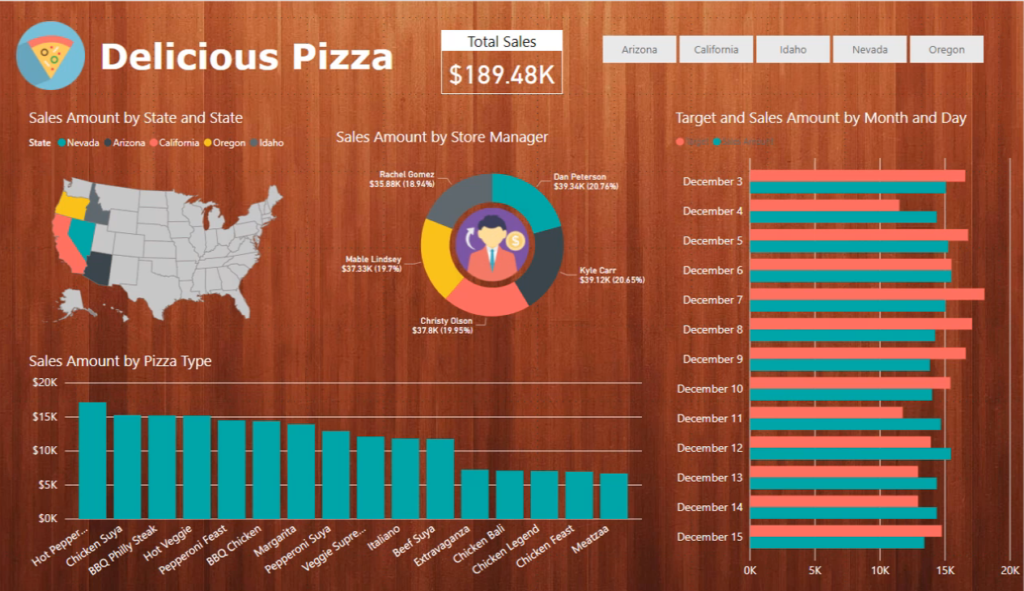
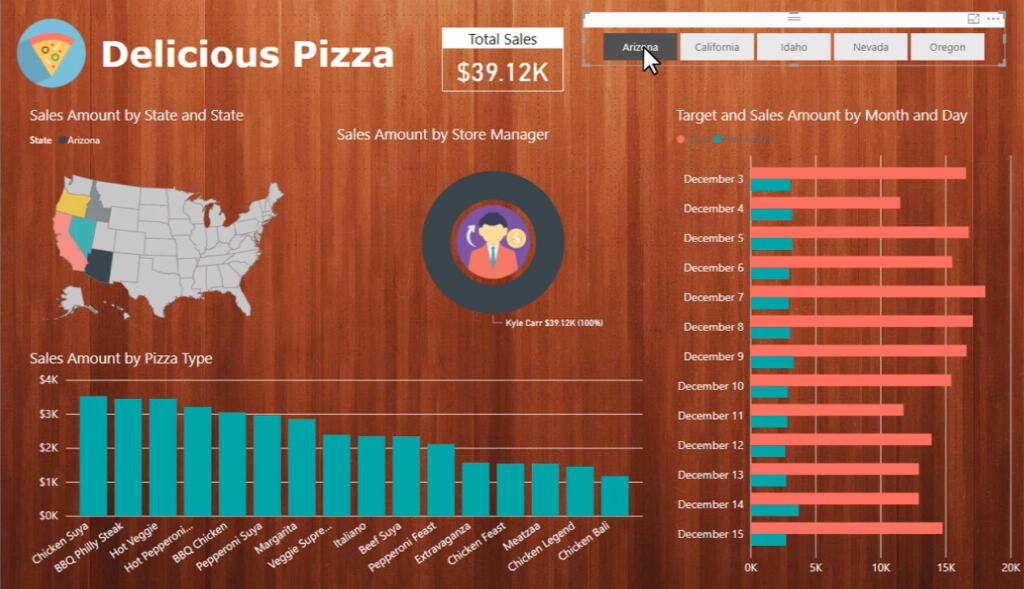
Delicious Pizza
Sample Dashboard:
Dataset:
- Download Delicious-Pizza Data Files.
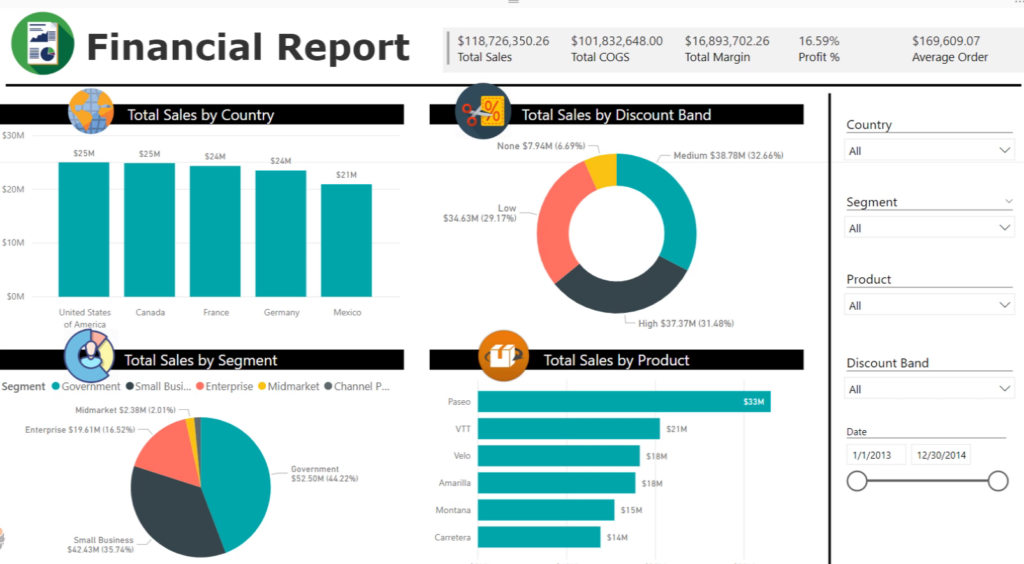
Dataset:
- Download Financial-Data Files.
Hints:
Transformation:
- Check all data type
- Create Date table
- Create New Measurements
- Total Sales [Sum of Sales]
- Total Margin [Sum of Profit]
- Total COGS [Sum of COGS]
- Sales vs COGS [Total Sales – Total COGS]
- Profit % [Total Margin / Total COGS]
- Average Order [Total Sales / Total Number of Row*(use COUNTROWS Function)]
Modeling :
- Create Relationship between Financial & Date table
Statistics Resources
Statistics Excel File

