Course Outline
-
Introduction
- Overview of Basic Sales Analytics Session
- Bird-eye view of Sales Data
- Getting Started with Power BI
- Get Data in Power BI and Develop Relationships
- Develop Key Calculation Table and Calculate Total Sales
- Develop Dates Table
- Calculate Total Cost and Total Profits
- Calculate Total Unit Sold, Total Products and Profit Margin Percentage
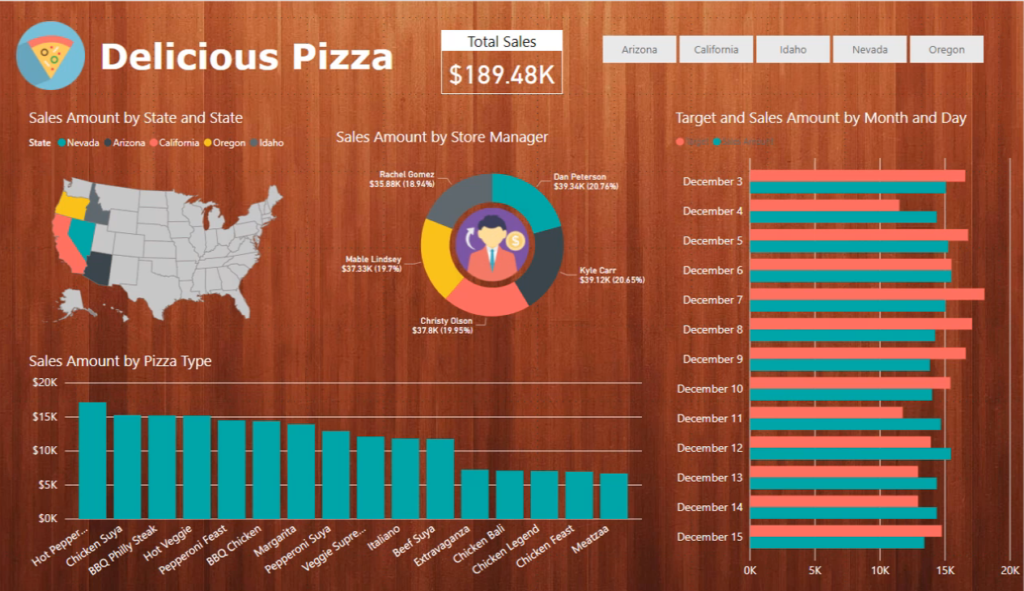
- Dashboard – Page Background with Title and key cards
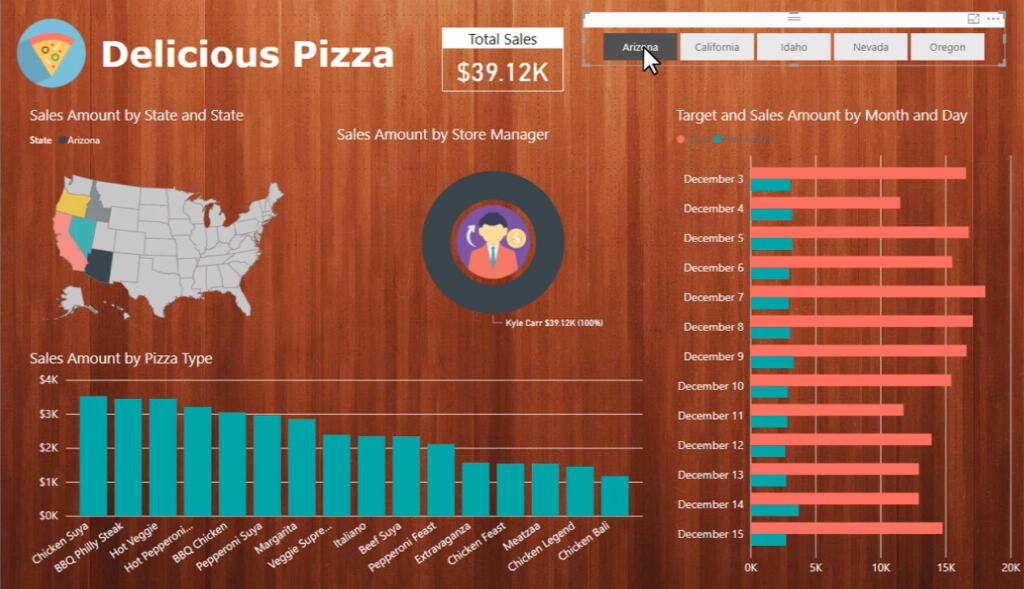
- Dashboard – Slicer of Years and Quarter
- Dashboard – Total Sales by Location, Dates and Salesperson
- Dashboard – Product-wise Sales with Map and Review of Sales Performance
-
Intermediate Sales Analytics Session
- Overview of Intermediate Sales Analytics Session
- Introduction of Intermediate Sales Analytics
- Product Insight – Calculate Top 5 Products
- Product Insight – Calculate Year on Year (YoY) Sales Growth
- Product Insight – Calculate Product Group Table and place it accordingly
- Product Insight – Create Scatter Chart with Product Growth Groups
- Product Insight Dashboard – Product Table Visualization
- Product Insight Dashboard – Scatter Chart and Top Products
- Product Insight Dashboard – Final Visualization and Product Review
- Customer Insight – Calculate Top 5 Customers
- Customer Insight – Time Intelligence Calculations
- Customer Insight – Customer Ranking in the Scatter Chart
- Customer Insight Dashboard – Final Visualization and Customer Review
- Sales Summary Dashboard – Final Visualization and Sales Review
- Sales Budget – Overview and Utilization of Time Intelligence Technique
- Sales Budget – Budget Formula and Final Visualization
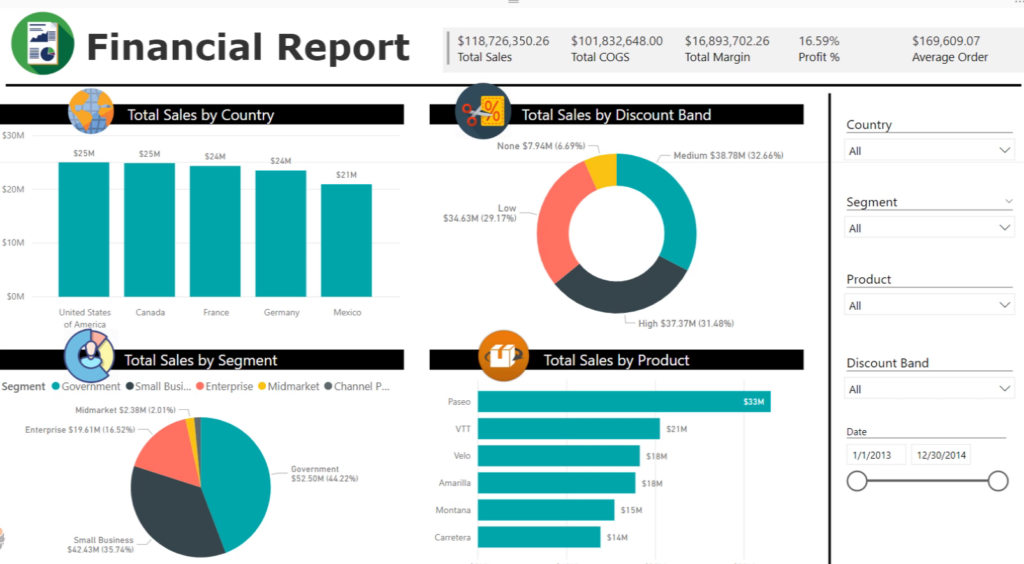
Practice Session (Financial Report)
Dataset:
- Download Financial-Data Files.
Hints:
Transformation:
- Check all data type
- Create Date table
- Create New Measurements
- Total Sales [Sum of Sales]
- Total Margin [Sum of Profit]
- Total COGS [Sum of COGS]
- Sales vs COGS [Total Sales – Total COGS]
- Profit % [Total Margin / Total COGS]
- Average Order [Total Sales / Total Number of Row*(use COUNTROWS Function)]
Modeling :
- Create Relationship between Financial & Date table
Practice Session (Executive Financial Report)
Your manager wants to see a report on your latest sales figures. They’ve requested an executive summary of:
- Which month and year had the most profit?
- Where is the company seeing the most success (by country)?
- Which product and segment should the company continue to invest in?
- Top 2 profitable Products.
- What is the Total sales without discount?
- Find Country-wise Sales %.
- What is the Product-wise Profit Margin % ?
- What is the Year to Date Sales Value?
- Need to find YoY Sales Growth
Note:
- Montana product was discontinued last month.
- All Segment Name Need to show in Uppercase
Dataset:
- Download Simple Financial Data File.
Extra Resources
Book
Blog Links for Choosing Right Chart
Course Outline
-
Module 1 Design a Data Model in Power BI
- Introduction to Data Modeling
- Working with Tables
- Dimensions and Hierarchies
Module 2 Create Model Calculations using DAX in Power BI
- Introduction to DAX
- Real-time Dashboards
- Advanced DAX
Module 3 Optimize Model Performance
- Optimize the data model for Performance
- Optimize DirectQuery Models
Module 4 Create Reports
- Design a Report
- Enhance the Report
Module 5 Create Dashboards
- Create a Dashboard
- Real-time Dashboards
- Enhance a Dashboard
Module 6 Perform Advanced Analytics
- Advanced Analytics
- Data Insights Through AI Visuals
Module 7 Create and Manage Workspaces
- Creating Workspaces
- Sharing and Managing Assets
Practice Session (Data Modeling)
- Data Modeling
- Training Dataset
- Lab Instructions
- Download Starter pbix file (Sales Analysis.pbix [.zip]) **[You need to Unzip the file and Open from Power BI file Menu]**